With the Christmas holiday chaos (somewhat literally this year) in the rearview, I’ve been playing a bit with the MusicBrainz data and the Flourish visualization library. First up was using some repurposed code to visualize Miles Davis recordings. I thought a sunburst diagram might be an interesting way to show album releases and the songs on each release. Turns out it wasn’t quite as simple as I thought…it never is!
After multiple query tweaks and iterations, I’ve got something fun and interesting. Miles produced so much music, with much of it re-released in multiple formats (think vinyl vs. cd) and in various collections, factors that wound up influencing my query and chart logic. As is the case for many jazz artists, multiple labels are an issue, so why not create a filter to view releases for each label (Columbia, Blue Note, etc.)? And many songs turn up on multiple releases (studio, live, collections), so we need to account for that as well.
So my thought with using a sunburst was to group songs and releases together, and allow filtering by label. Mind you, it took multiple attempts to get the data in the best format, but we eventually wound up with something workable to feed the sunburst chart.
If you aren’t familiar with the sunburst chart, here’s a quick primer. The goal of a sunburst chart is to display hierarchical information in a circular layout with 2 or 3 levels (typically). The outer layer has more surface area to work with, and successive inner layers each have less visual space to use. For this reason, I wound up using individual songs in the outermost layer, with their respective albums as the inner layer. With an average of perhaps 5-10 songs per album, this takes advantage of the sunburst hierarchy framework.
Here’s what the code eventually became, after multiple iterations:
SELECT distinct ac.name AS artist, l.label_code, l.name AS label_name, r.name AS release, mf.name AS format, t.name AS id, t.name AS label, t.name AS name,
r.name AS recording,
CASE WHEN t.length < 180000 THEN ‘< 3 Minutes’ WHEN t.length < 300000 THEN ‘3-5 Minutes’ WHEN t.length < 420000 THEN ‘5-7 Minutes’ WHEN t.length < 600000 THEN ‘7-10 Minutes’ WHEN t.length > 600000 THEN ’10+ Minutes’
ELSE ‘No Length’ END category
FROM public.release r
INNER JOIN public.artist_credit ac
ON r.artist_credit = ac.id
INNER JOIN public.medium m
ON r.id = m.release
INNER JOIN public.medium_format mf
ON m.format = mf.id
INNER JOIN public.release_label rl
ON r.id = rl.release
INNER JOIN public.label l
ON rl.label = l.id
INNER JOIN public.track t
ON m.id = t.medium
INNER JOIN public.recording re
ON t.recording = re.id
WHERE r.artist_credit = 1954
and mf.name = ’12” Vinyl’
ORDER BY l.name, r.name
What we’re doing here, in a nutshell, is retrieving all the information for Miles Davis’ 12″ vinyl releases; many of these recordings were eventually released on CD, so we’re attempting to avoid duplication here. The ‘r.artist_credit = 1954’ line refers to Miles Davis and his MusicBrainz artist ID, while the medium_format name field is set to grab just 12″ vinyl releases.
Enough of the technical details – let’s view some results:
Here’s a look at the dropdown filter we created using labels:

Note that we ordered our query by both label name and release name; this translates to an alpha sorted dropdown on labels, making it much more intuitive to select a specific label. We can choose to display all labels, but that gets rather messy for an artist like Miles who recorded for or was re-released by many companies. Let’s filter it down to Columbia, a major label who Miles recorded for many times:


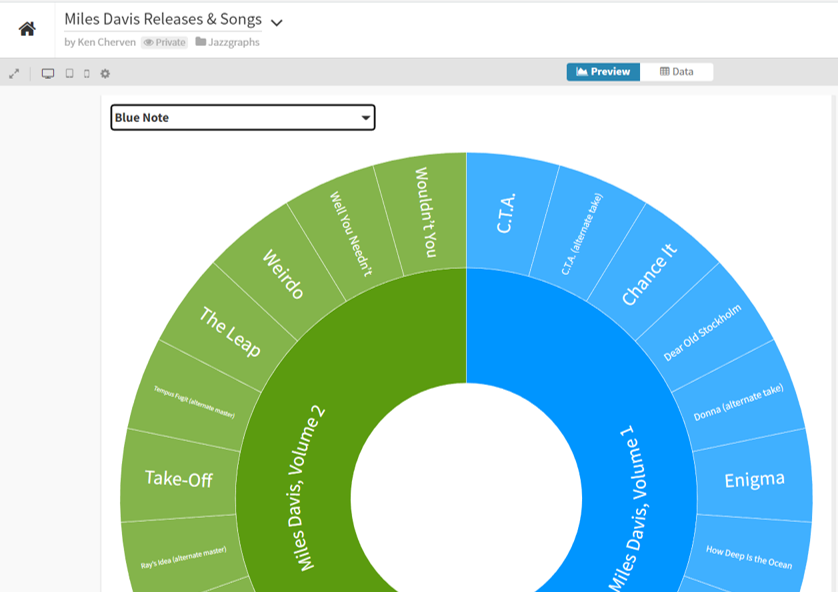
The inner circle displays individual releases, of which there are many, while the outer ring displays the songs on each release. The Flourish sunburst charts are interactive, but it’s a challenge to see what’s going on in our static image. Let’s move to the Blue Note label, a major force in jazz, but one where Miles was not a major player:


Now we can see the layout, with album releases surrounded by individual songs. We can go a step further by clicking on the Miles Davis, Volume 1 layer, which reveals the following:


Now we are focused strictly on that release and can easily view the songs on that album. Hope you get the general idea for how the sunburst charts work. Now have a go at it yourself with the live version:
I’ll have more of these to come, as it feels like a great way to capture a lot of information in a fun, interactive layout. See you soon, and thanks for reading!