For the last few year at JazzGraphs I’ve depended on the MusicBrainz database to draw data that populates many of the network graphs and other visualizations on the site. It’s an immense dataset that can be downloaded (as I’ve previously done) or accessed via the MusicBrainz API (Application Programming Interface). For upcoming visualizations, I’ve elected to go the API route, but simply as a means to access data, not to use in traditional API fashion. This approach allows for querying the topics I choose – specific artists, genres, recordings, etc. and pull down only the data needed to create a visualization.
Let’s walk through a simple example for how the API can be used, stopping short of building any networks or charts for now. We’ll start with a screenshot of the API page:
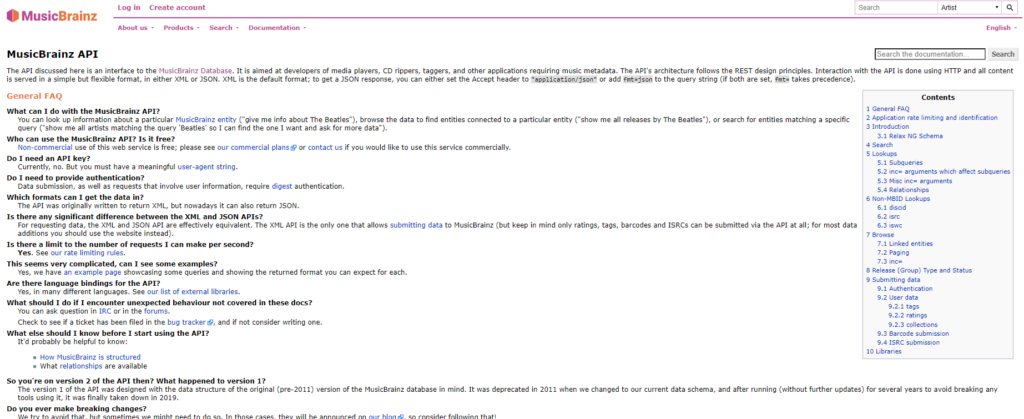
Notice in the upper right the Search box and a dropdown list of categories. This is where we can start retrieving data. Let’s do a quick search on John Coltrane by entering his name in the search box and selecting the Artist category. Here are the results:
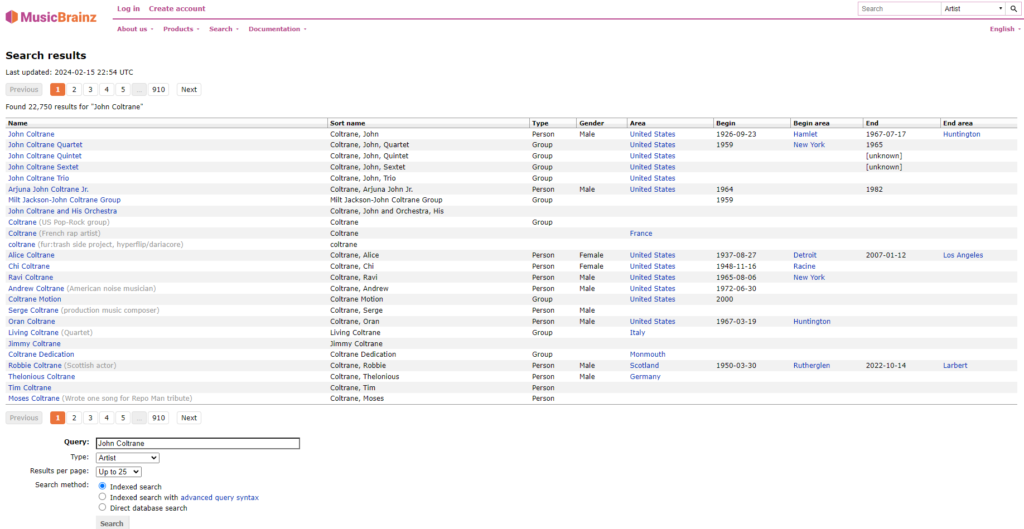
This query yielded more than 22,000 results. Let’s narrow the results by selecting the John Coltrane Quartet from the results. We now have a much smaller set of results:
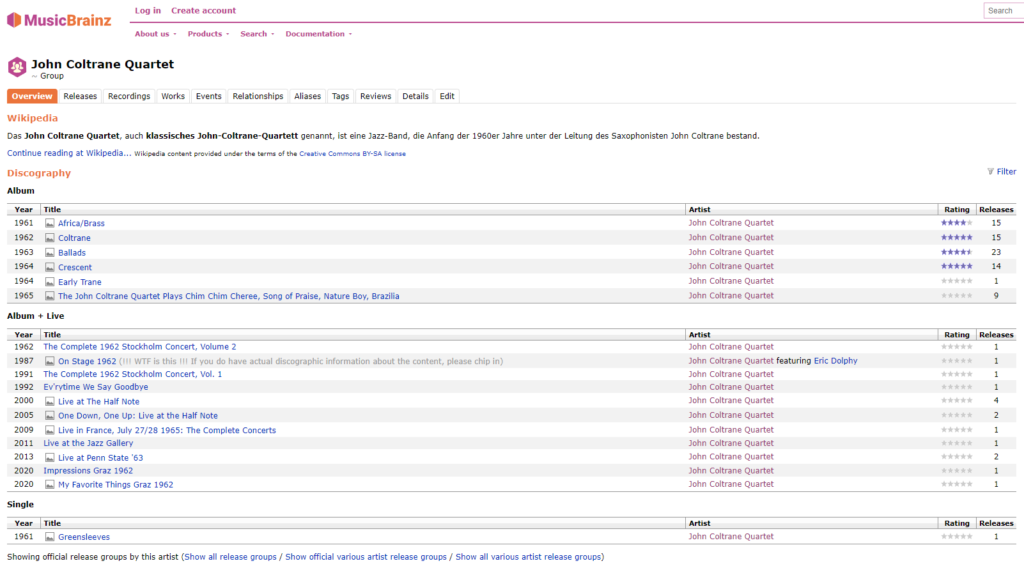
Note that we are seeing an Overview of the results; we can also select any of the other tabs to further refine the results. We’ll choose Recordings:
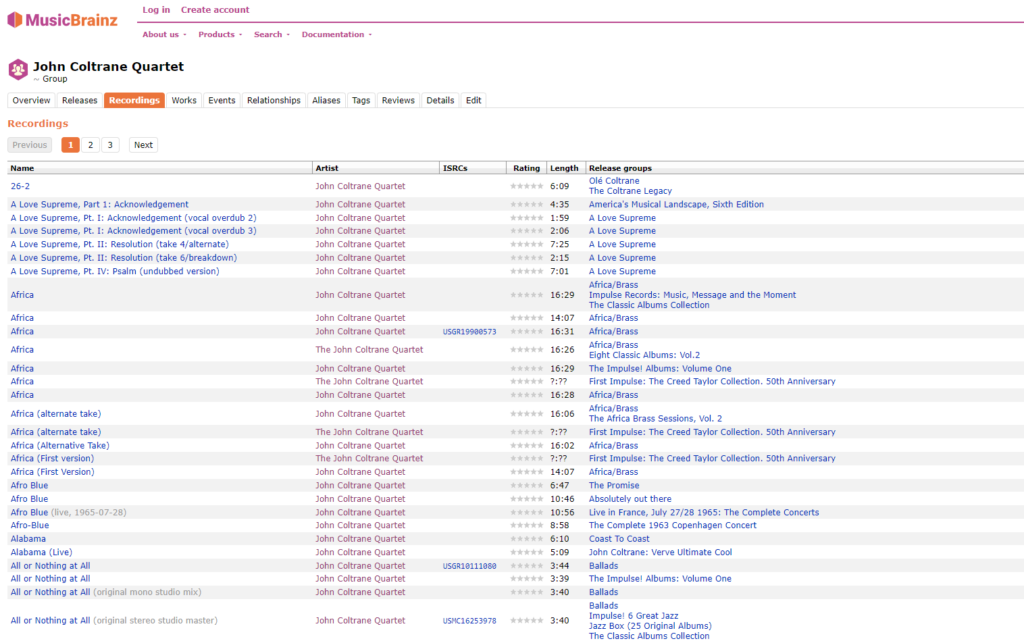
We now have a detailed listing of all songs recorded by the quartet, along with some related information such as song length and release groups. Next, let’s explore the Relationships tab, and see what we find:
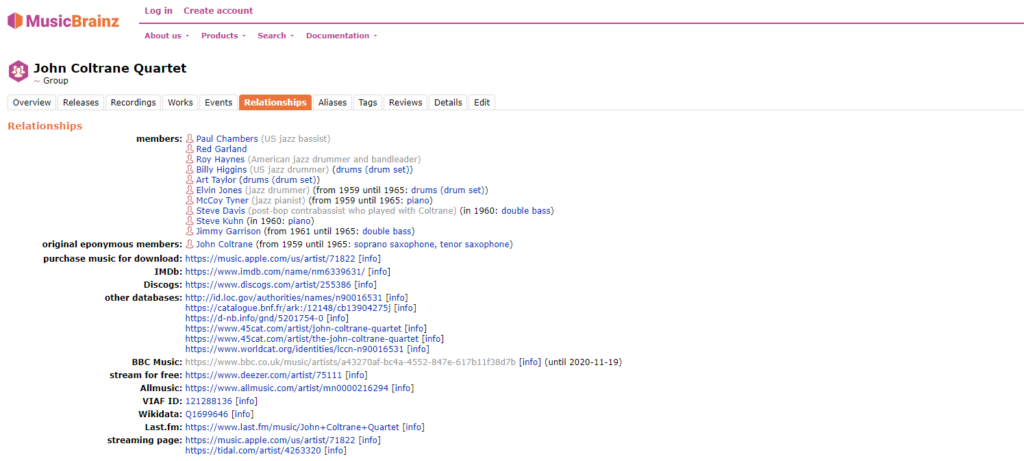
Now we see all the band members who played in the quartet, as well as entries at other sites such as Allmusic and Discogs. It’s pretty powerful information all knit together via the API. I’m excited to start taking this type of data and pulling it together in a variety of data visualizations; network graphs are an obvious choice (connecting artists to recordings to labels, etc.) but there are many other possibilities.
Stay tuned for some upcoming examples I’ll pull together.
