Welcome to the JazzGraphs website! This site will feature a variety of visualizations documenting the fascinating history of jazz music – the artists, labels, and recordings that make up this great American art form.
My goal is to apply my data visualization skills to create memorable images that capture the amazing history of jazz music in ways that are creative, innovative, and visually gorgeous. Here’s one example to provide an idea where this site is headed:
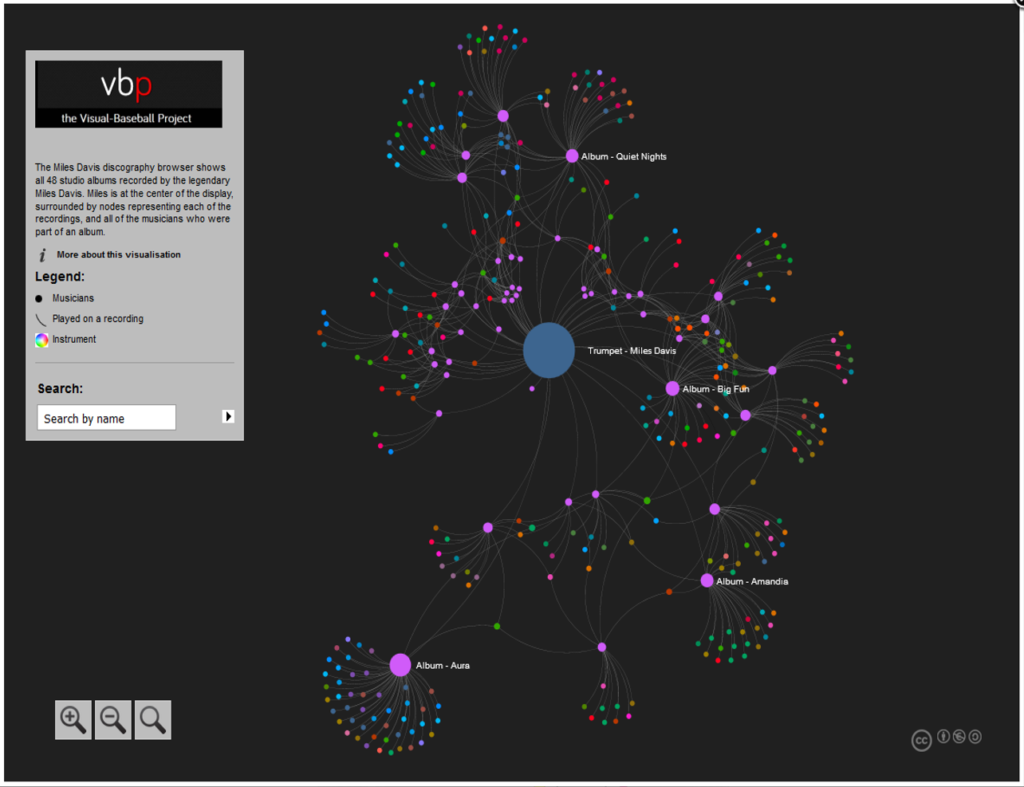
This is a snapshot of a network graph detailing the studio albums of jazz legend Miles Davis, along with all of the sidemen playing on each recording. Many of the visualizations will take this general form, but other data visualization approaches will also be utilized. Lots of the graphs will be interactive, allowing you to have a fun exploring the myriad relationships surrounding an artist, label, or recording.
The eventual goal will be to turn some of these graphs into printed posters and a book sometime in 2018. More details on timing to follow in future posts.
