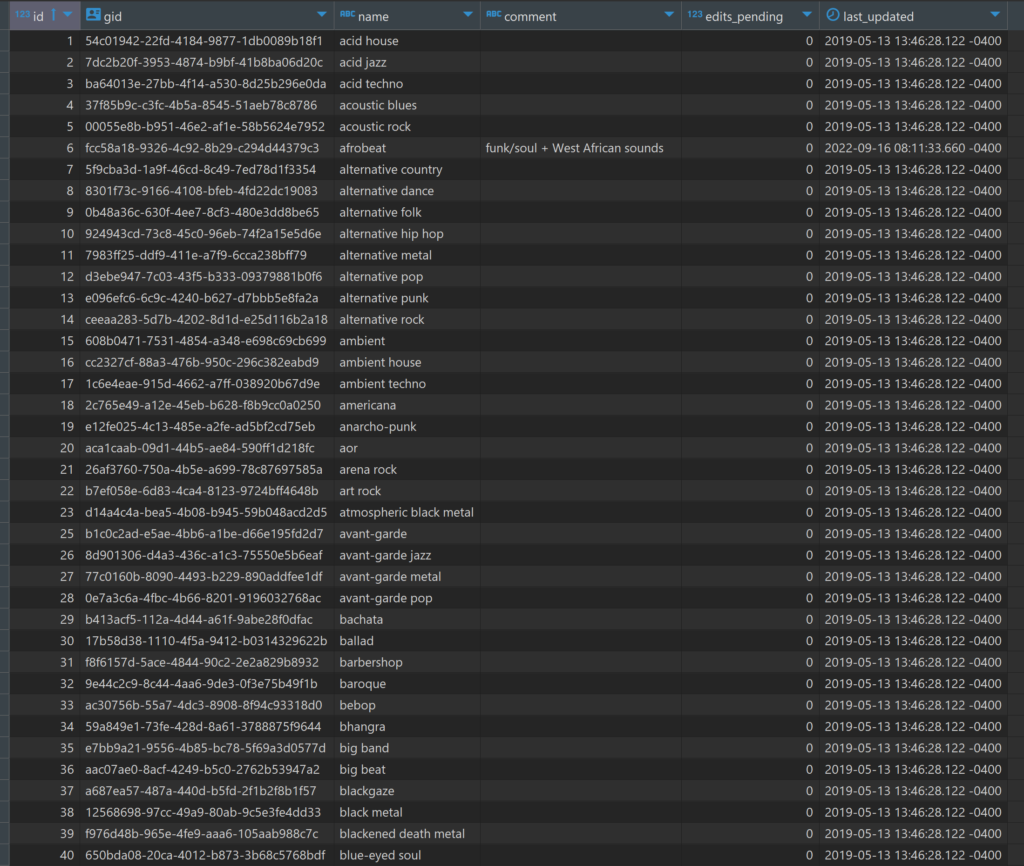
My last post showed a little bit about the musical genre data structure in the MusicBrainz database. In this post we’ll expand our view to include all genres and sub-genres, and look at a few visualization approaches using Flourish.
Flourish provides several options for visualizing hierarchical data; in this post we’ll look at some of the advantages and disadvantages of each approach. Ultimately, my goal is to categorize all my CDs and vinyl using this approach, but for now we’ll work with the MusicBrainz genre data.
We had a quick look at a sunburst chart in the prior post, so we’ll begin there with the much larger dataset we now have. How does it work?
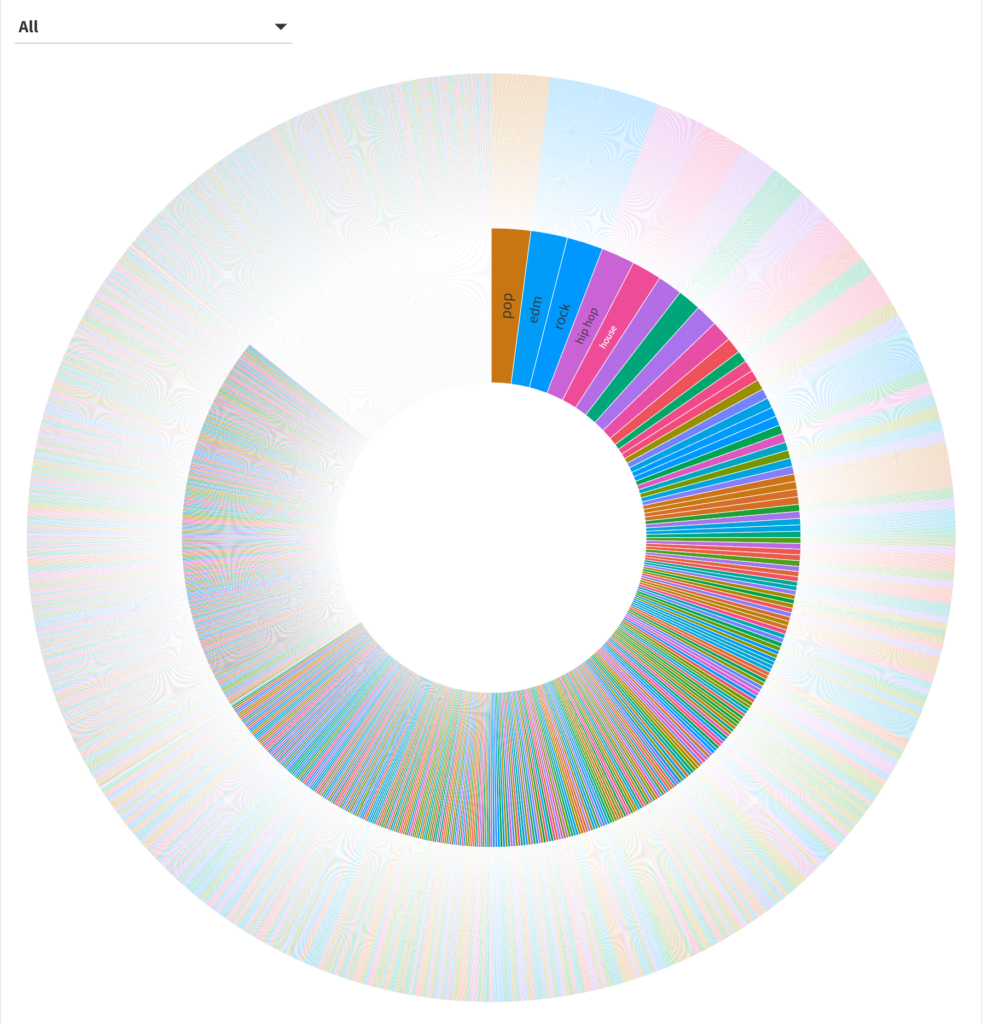
Hmmm…it’s a little challenging to see the data beyond the first few genres (these are the ones with the most sub-genres). We can narrow our focus by using the filter or by clicking on one of the inner circle genres. Let’s look at the rockgenre:
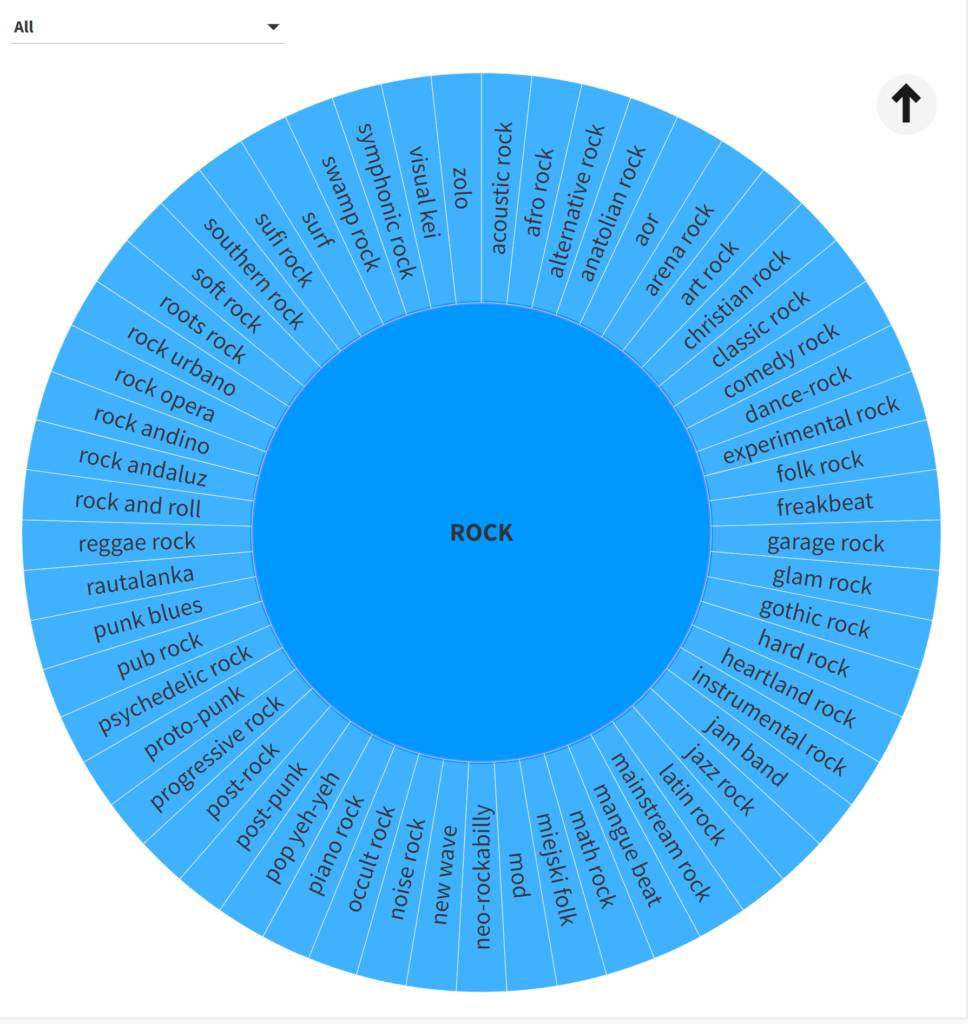
That’s a bit better; note that each sub-genre has an identical size here, something that will change once I feed my own music collection into Flourish. At least we can now identify all the sub-genres in the data.
What about a treemap approach? Treemaps can be useful in showing categories and sub-categories, sized by count or some other value (revenue, sales, profit, etc.). Here’s a look at all the data:
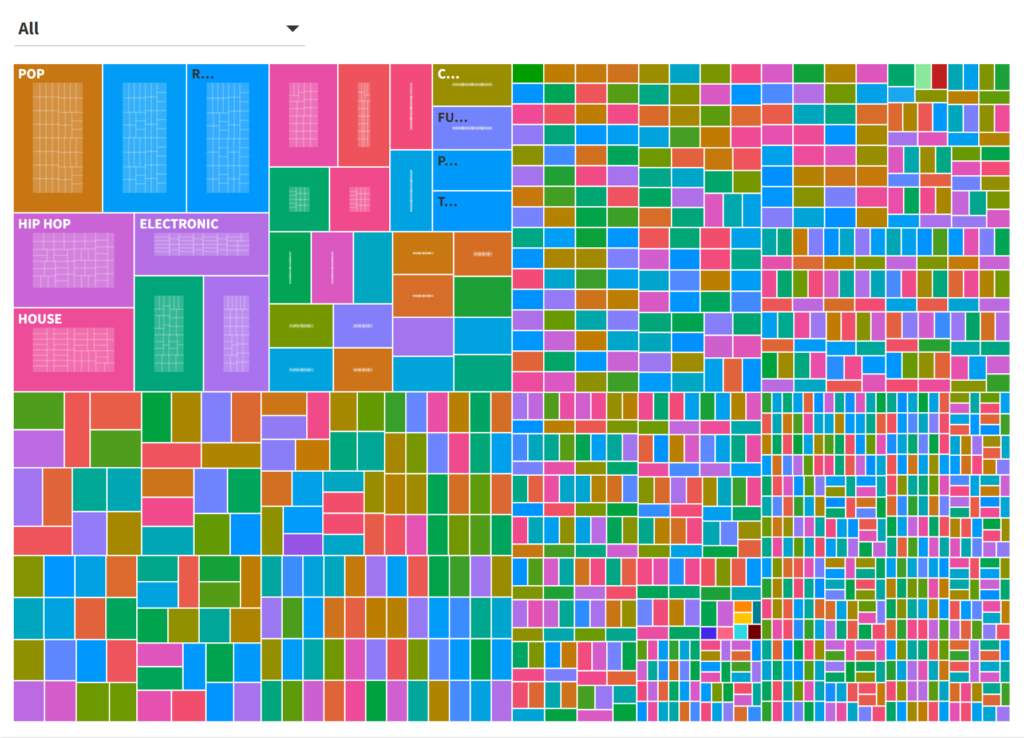
Once again, it’s a challenge to see anything beyond the most frequently occurring genres; even if we provide a pop-up label it’s not very user-friendly. Let’s filter down, this time in the electronicgenre:
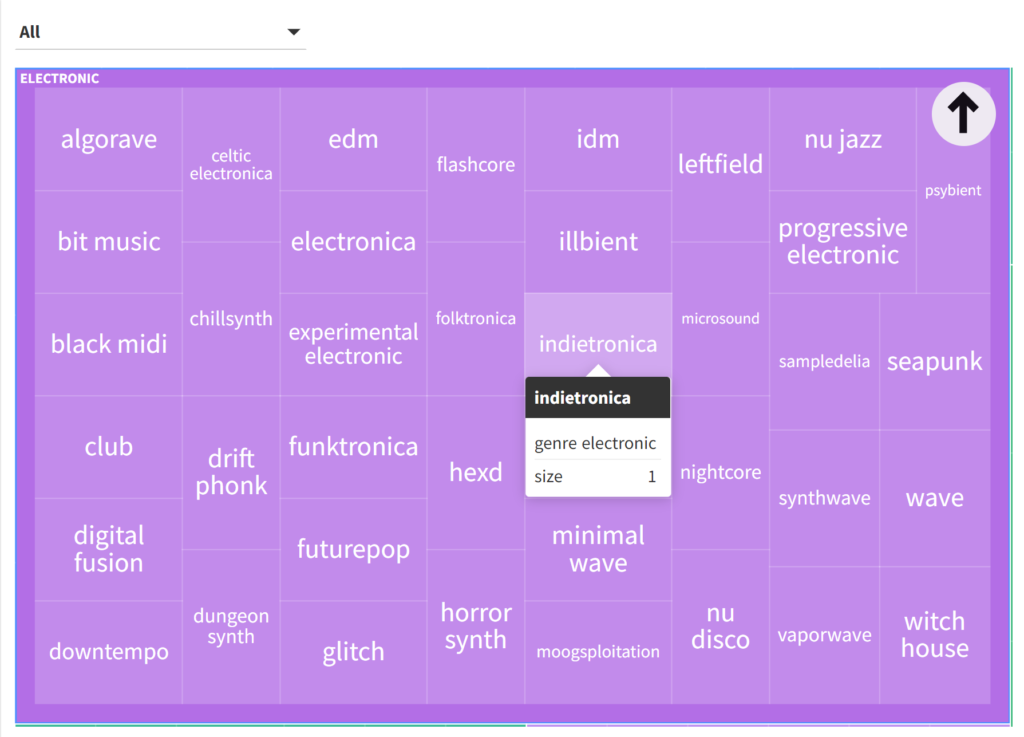
Here we get a similar result to the sunburst, albeit in a different layout. Again, this could be more interesting with an actual record collection, where each sub-genre would potentially be sized differently, with some not even appearing (i.e.- no recordings in a sub-genre).
Our next example will use circles, an approach sometimes known as circular packing. All genres will be arranged in a somewhat random layout, rather than the radial or rectangular formats we have just seen. Here is a look at all genres:
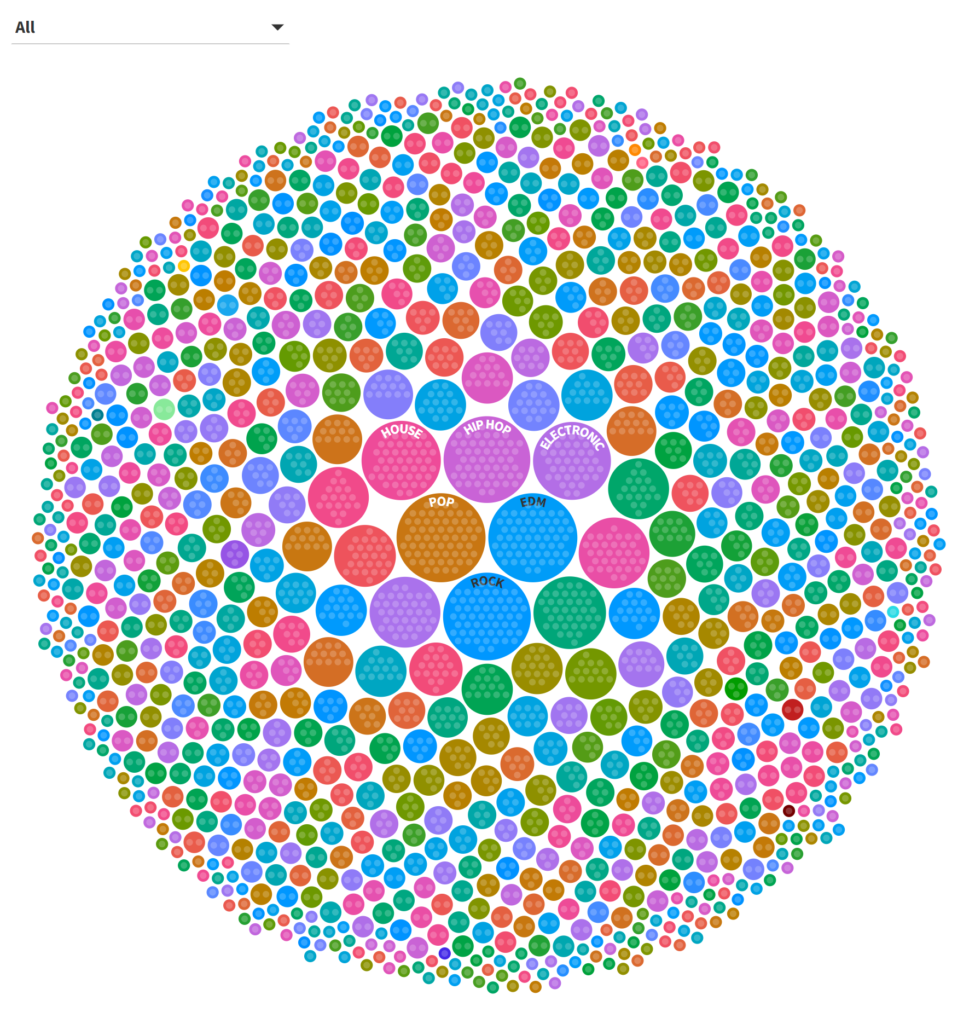
Once more, we have a similar issue to the sunburst and treemap displays, although it is fairly easy to see the highest frequency genres in the center. Filtering on the popgenre yields a series of identical sized circles for all pop sub-genres:
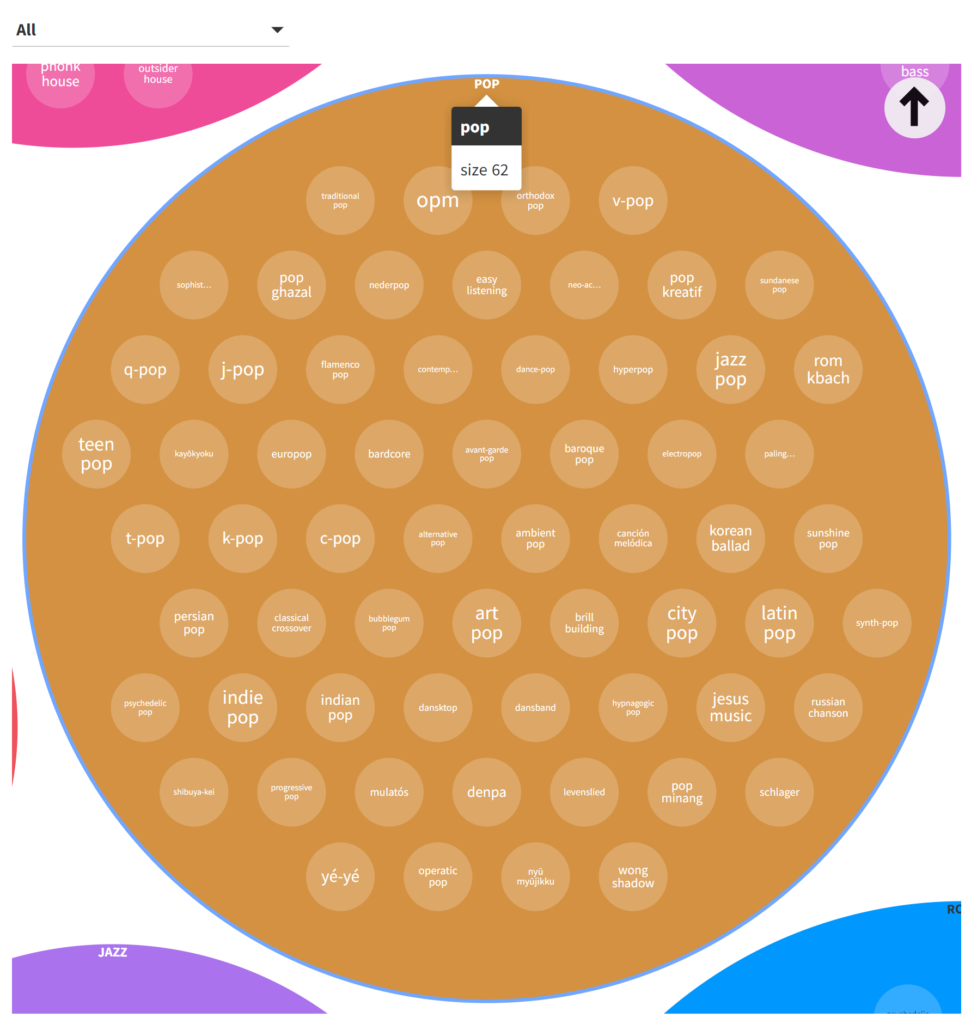
The circle approach is perhaps my least favorite of the three we have seen thus far, due to the seemingly more random placement of the individual circles.
At the opposite end of the spectrum we can use bars to view the same data. Here we are able to clearly see the rank order and relative frequency for each genre:
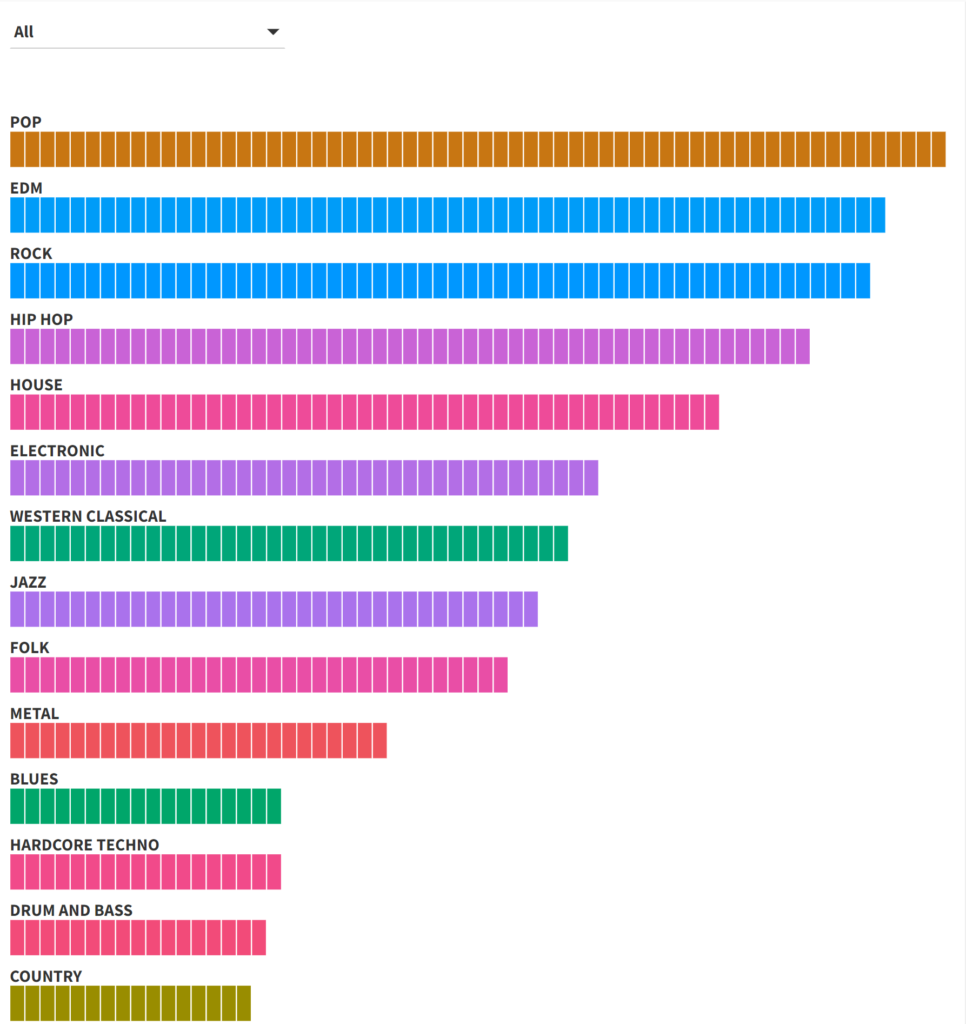
This looks really good for the high frequency genres – clear labels with easy to distinguish relative frequencies. The downside is when we have hundreds of genres; our bar chart becomes incredibly tall from top to bottom. In short, this approach will be effective for a limited number of genres, although the same could be said for the other methods.
Our final approach uses a radial tree option in Flourish. This method most closely mimics the sunburst option, with results laid out in a circle; genres can then be clicked on or filtered to get to the sub-genre level. Here are all genres:
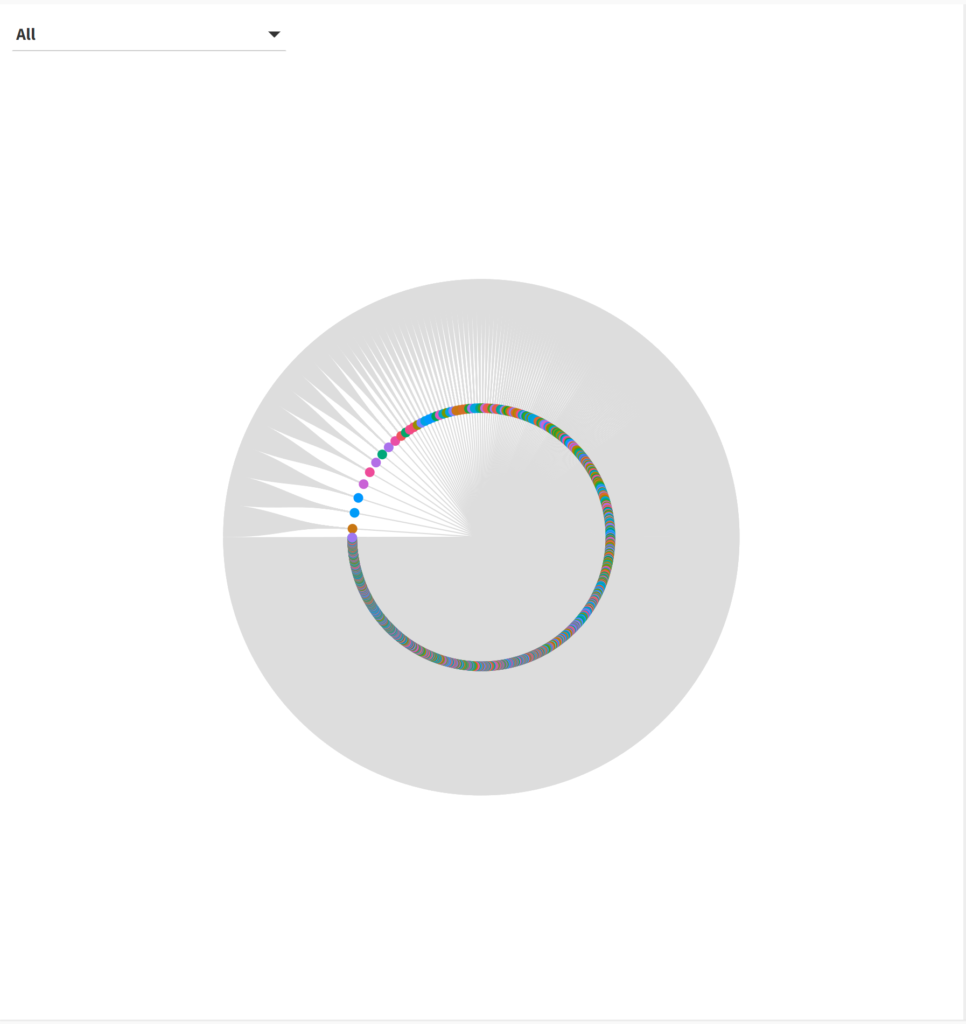
Not exactly helpful, is it? There are simply too many genres and sub-genres to display; even the sunburst chart provided more information at first glance. But what about when we select a single genre, such as reggae?
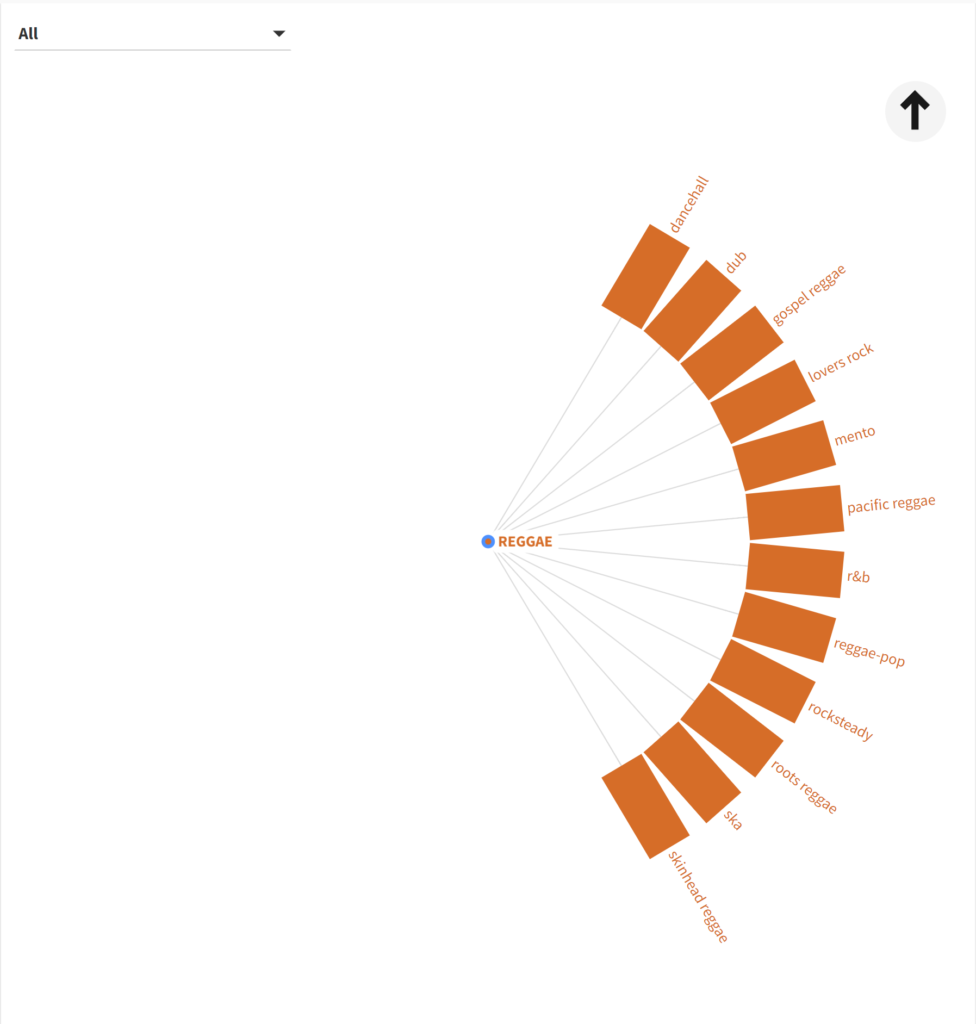
That’s better! We now have a clear, concise display to work with. This could prove to be useful when we have different size values for each sub-genre; in essence it will merge the best aspects of the sunburst and bar displays. I’ll be interested in seeing this sort of display when my music collection data is complete to see how well it handles differing sizes.
So which approach is best? I’m going to say that it depends on the underlying data; none of these charts was great when we attempted to view all genres at once, but they do appear to offer potential when the data has fewer categories (genres). Personally I like the sunburst and radial methods for the clarity of their display coupled with the visible connection between the sub-genres and the parent genre. I’m eager to see how they work with a more typical dataset.
That’s it for now – hope you enjoyed this, and thanks for reading!
