I recently shared some venue maps created in Carto using MusicBrainz data where we can see all the musical venues (with lat/lng coordinates) listed in the database. Now that I am exploring Flourish as a visualization tool, it is time to test the mapping capabilities to see if it provides a viable alternative for geographic visualization.
As with the Carto map, the first step is to retrieve the data with a query from my local MusicBrainz database:
select p.”name” , p.address , p.coordinates , split_part(trim(p.coordinates ::text, ‘()’), ‘,’, 1)::float AS lat,
split_part(trim(p.coordinates ::text, ‘()’), ‘,’, 2)::float AS lng,
pt.”name” as type, ar.name as locale
from place p
inner join place_type pt
on p.”type” = pt.id
inner join area ar
on p.id = ar.id
where p.coordinates is not null
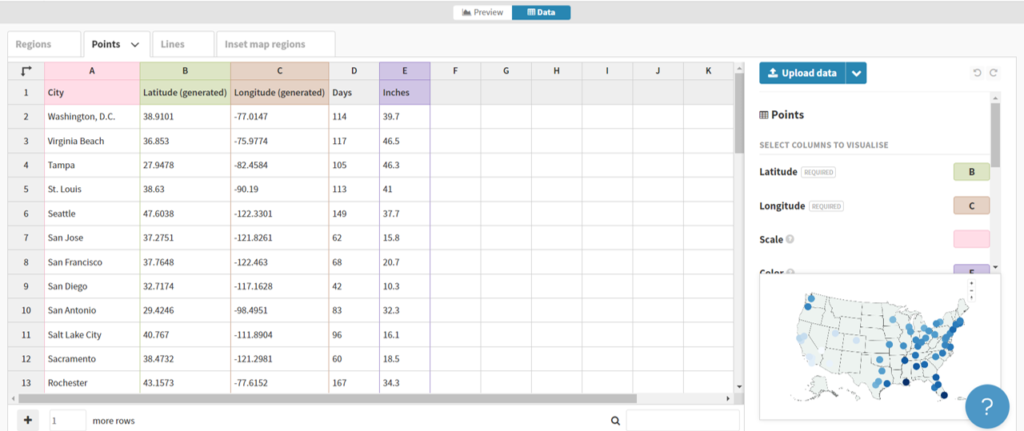
The results are exported to a .csv file for ingestion by the Flourish map template. In this case we are using a point map to display venues using the latitude (lat) and longitude (lng) data we just created. Before uploading our data, we can see that Flourish provides an easy to use template populated with sample data, allowing us to see the data format we need to deliver:

Here we can see a name field (City) and latitude and longitude fields for positioning points on a map. Other attributes provide data that might be used for sizing, coloring, or context.
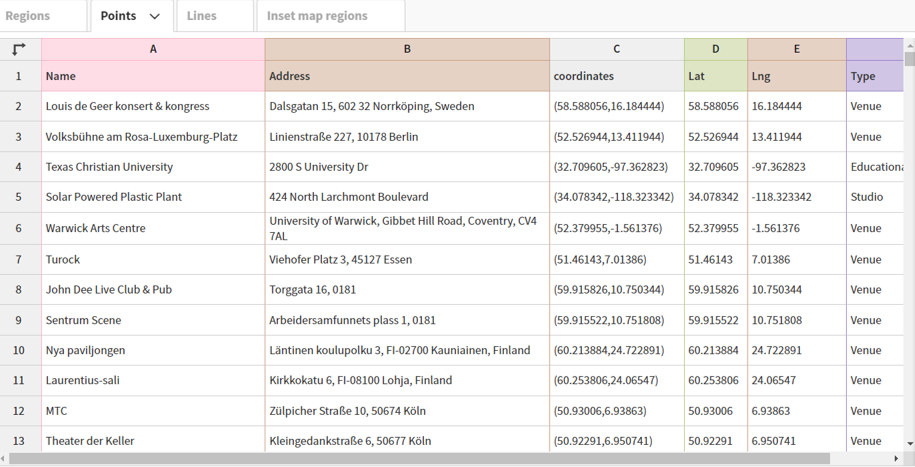
In our case, we can upload our venues .csv file in this general format, and then tell Flourish which columns to use. Here’s what our data looks like after uploading:


Now that the data has been uploaded we can specify which columns to use. Rather than using column names (Name, Address, etc.), Flourish works off the actual column locations (A, B, C, etc.). These are the values we need to input in the options tab. We can use A, B, and F for describing the data with labels and/or popups, use D for latitude and E for longitude, and switch from the Date to the Preview pane.
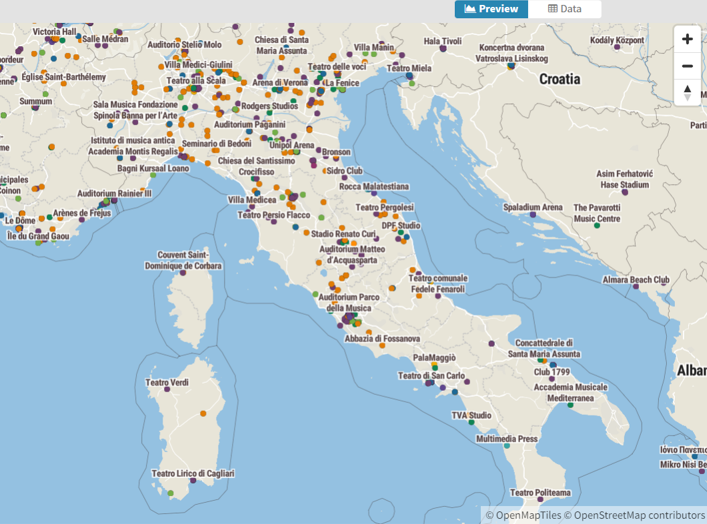
When we complete that task, Flourish gives us an attractive map, with many templates to choose from, and dozens of options for styling the map and surrounding area:


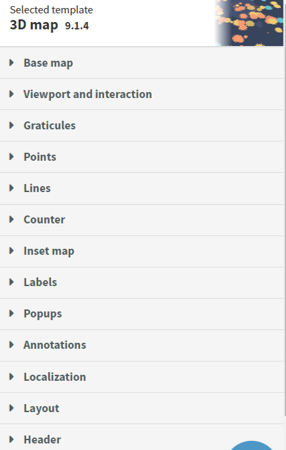
Here’s a quick view of the many available categories for styling your map:

We’ll skip the details for now, but it is obvious that we could do an amazing number of things to customize our map.
To answer my earlier question, it appears that Flourish will be more than capable for mapping a variety of data, and I’m looking forward to testing it with much larger data sets. See you soon, and thanks for reading!